File:2021-11-27 at 10-23-58.screen.analysis of GW denial claims.time charts.png
Jump to navigation
Jump to search

Size of this preview: 800 × 443 pixels. Other resolutions: 320 × 177 pixels | 1,099 × 608 pixels.
Original file (1,099 × 608 pixels, file size: 109 KB, MIME type: image/png)
Summary
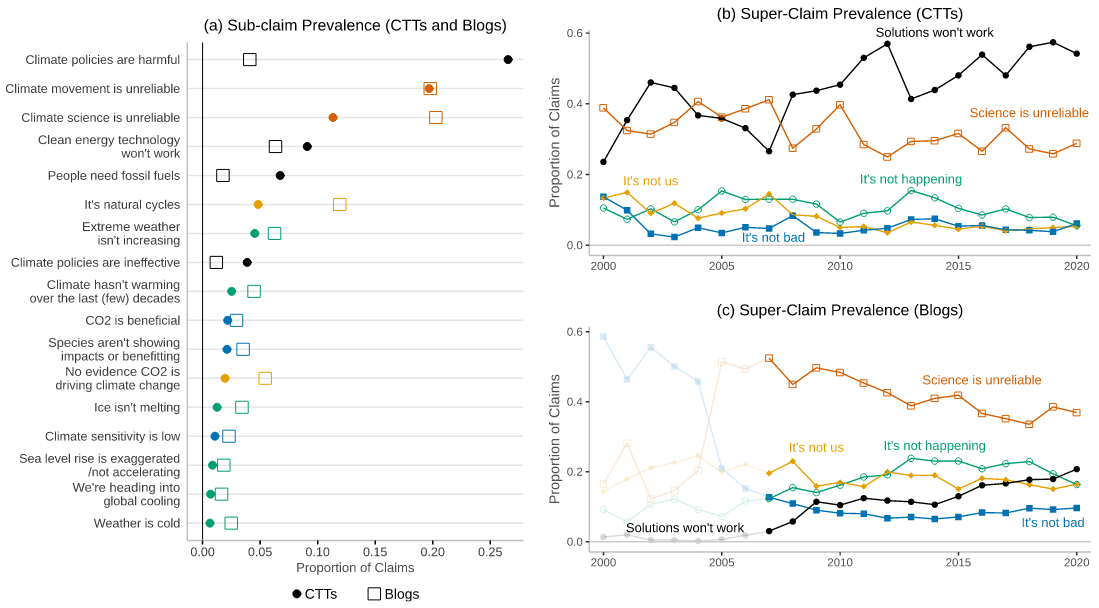
- what: chart showing prevalence of several global warming denialist claims in blogs and CTTs (conservative think-tank posts) over time
- retrieved from nature.com(PDF) on 2021-11-27
File history
Click on a date/time to view the file as it appeared at that time.
| Date/Time | Thumbnail | Dimensions | User | Comment | |
|---|---|---|---|---|---|
| current | 15:32, 27 November 2021 | | 1,099 × 608 (109 KB) | Woozle (talk | contribs) | * '''what''': chart showing prevalence of several global warming denialist claims in blogs and CTTs (conservative think-tank posts) over time * '''retrieved''' from [https://www.nature.com/articles/s41598-021-01714-4.pdf nature.com](PDF) on 2021-11-27 |
You cannot overwrite this file.
File usage
The following page uses this file: